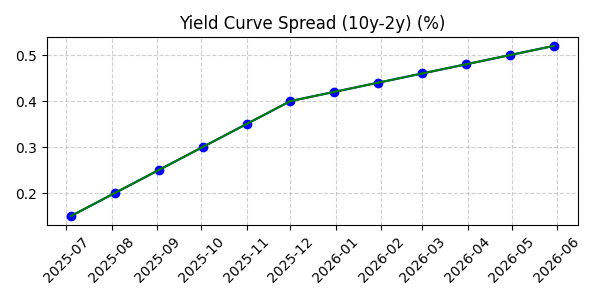
Yield Curve Spread (10y-2y)
A steeper yield curve (higher spread) points to improving growth expectations and reduced recession risk.

| Month | Value |
|---|---|
| Sept 2025 | 52.16 |
| Oct 2025 | 52.38 |
| Nov 2025 | 53.30 |
| Dec 2025 | 53.90 |
| Jan 2026 | 54.18 |
| Feb 2026 | 55.15 |
Market Significance and Investing Insights
The yield curve represents the relationship between short‑term and long‑term Treasury yields. Investors track the spread between 10‑year and 2‑year notes because it signals how monetary policy and economic growth expectations are shifting.
A normal upward‑sloping curve suggests steady economic expansion and healthy risk appetite. When the curve steepens because long rates rise relative to short rates, investors expect stronger growth【57070725976679†L55-L67】.
A steep yield curve can indicate rising inflation expectations—long‑term rates jump as investors demand compensation for future price growth. By contrast, a “bull steepening” where short rates fall faster than long rates usually signals easier monetary policy and is bullish for stocks【57070725976679†L112-L117】.
An inverted curve—where short rates exceed long rates—often precedes recessions. It reflects expectations for lower growth and encourages investors to reduce exposure to cyclical sectors【57070725976679†L73-L76】.
Bear steepening happens when long‑term yields rise faster than short‑term yields, usually because of inflation fears and tighter financial conditions. This can pressure equity valuations, especially rate‑sensitive sectors【57070725976679†L146-L163】.
Keeping an eye on yield‑curve shifts helps investors gauge recession risk, assess when to rotate into defensive assets, and identify periods when risk‑on positions may be rewarded.
Extended Chart (6 Months Past & Future)