M2 Money Supply
Growth in broad money supply reflects expanding liquidity available for financial markets.

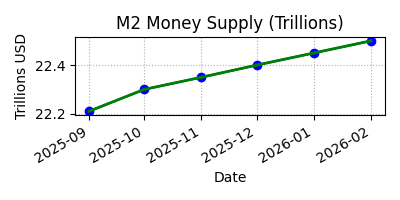
| Month | Value |
|---|---|
| Sept 2025 | 51.80 |
| Oct 2025 | 52.20 |
| Nov 2025 | 53.31 |
| Dec 2025 | 54.06 |
| Jan 2026 | 54.29 |
| Feb 2026 | 54.67 |
Market Significance and Investing Insights
The M2 money supply measures the total money in circulation and near-cash assets such as savings deposits and money market funds. It provides insight into the amount of liquidity available for investment and spending, serving as a key barometer of monetary policy.
- Liquidity driver: When the M2 supply grows rapidly, there is more money available for consumers and businesses to spend and invest. This can fuel stock market rallies as investors have greater cash balances to allocate to risk assets.
- Inflation and policy signals: Sharp increases in M2 can precede inflationary pressures. If the broad money supply grows faster than economic output, the excess liquidity may drive up prices. Central banks often respond by raising interest rates to slow money growth and cool the economy.
- Recession indicator: Declines in M2 growth or outright contraction may signal that monetary policy is restrictive or that credit conditions are tightening. Historically, significant slowdowns in M2 growth have preceded recessions. Monitoring trends in M2 helps investors assess whether liquidity conditions are supportive or restrictive for equities.
Overall, tracking the direction of M2 supply helps investors determine whether abundant liquidity is boosting markets or whether tightening conditions could lead to headwinds for risk assets. Combining this indicator with yield curve trends, Fed policy, and earnings growth provides a more complete view of macro conditions.
Extended Chart (6 Months Past & Future)