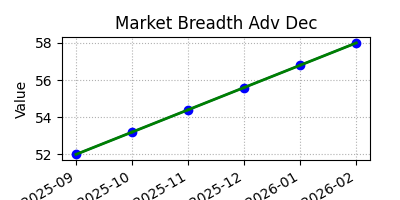
Market Breadth (Adv/Dec)
Narrowing breadth often precedes market corrections as fewer stocks lead the index.

| Month | Value |
|---|---|
| Sept 2025 | 55.82 |
| Oct 2025 | 54.77 |
| Nov 2025 | 53.52 |
| Dec 2025 | 52.48 |
| Jan 2026 | 52.50 |
| Feb 2026 | 50.90 |
Market Significance and Investing Insights
Market breadth looks beneath the surface of the major indexes to assess how many stocks are actually participating in a rally or decline. Breadth indicators such as the advance‑decline line compare the number of advancing stocks to declining stocks.
A broad advance—when most stocks rise together—signifies a strong and healthy bull market. Conversely, when only a handful of large names are pushing the index higher and the majority of stocks are declining or flat, it is known as narrowing breadth and often precedes corrections or bear markets. Traders use market breadth to confirm index trends and spot divergences that may signal upcoming reversals.
Extended Chart (6 Months Past & Future)