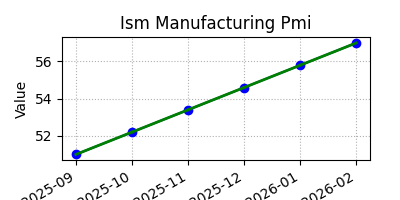
ISM Manufacturing PMI
Manufacturing PMI values below 50 indicate contraction; an uptick above 50 signals recovery.

Market Significance and Investing Insights
| Month | Value |
|---|---|
| Sept 2025 | 53.05 |
| Oct 2025 | 54.53 |
| Nov 2025 | 55.86 |
| Dec 2025 | 56.83 |
| Jan 2026 | 57.47 |
| Feb 2026 | 59.20 |
The Institute for Supply Management’s (ISM) manufacturing Purchasing Managers’ Index (PMI) is a leading indicator of U.S. economic health. It is derived from surveys of managers at hundreds of factories, covering new orders, production, employment, supplier deliveries and inventories. Readings above 50 signal expansion in manufacturing activity, while readings below 50 indicate contraction.
Investors watch the ISM PMI because it often moves ahead of the broader economy and the stock market. A rising PMI suggests stronger demand, improving earnings and higher stock prices, whereas a falling PMI points to weakening growth and greater recession risk. Momentum above the 50 level is generally bullish for equities, while a drop below 50 tends to be bearish.
Extended Chart (6 Months Past & Future)